Lens Lab Dashboard n., optical lab operations
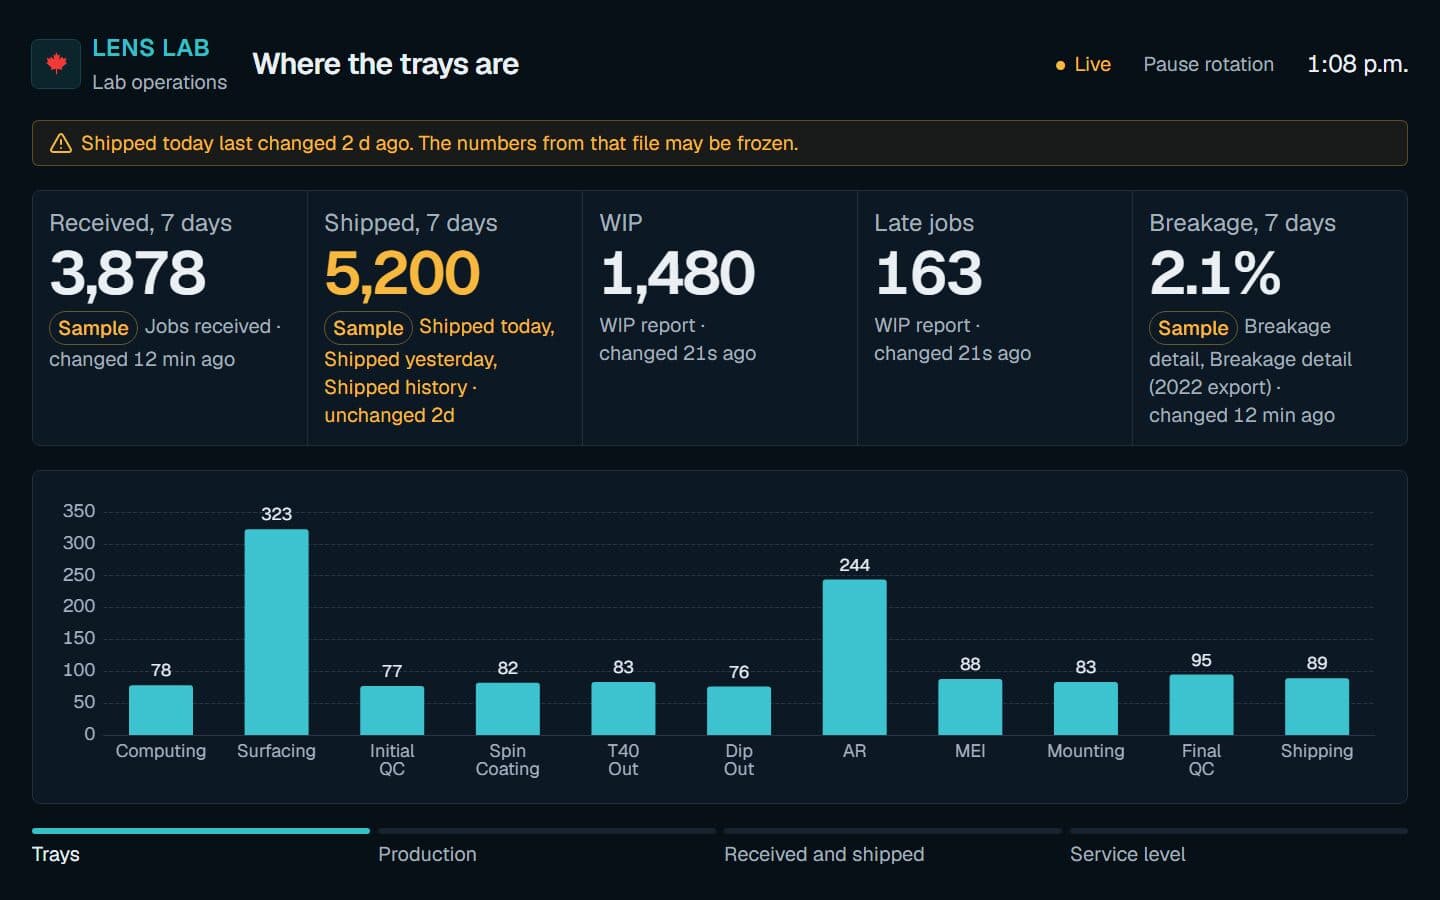
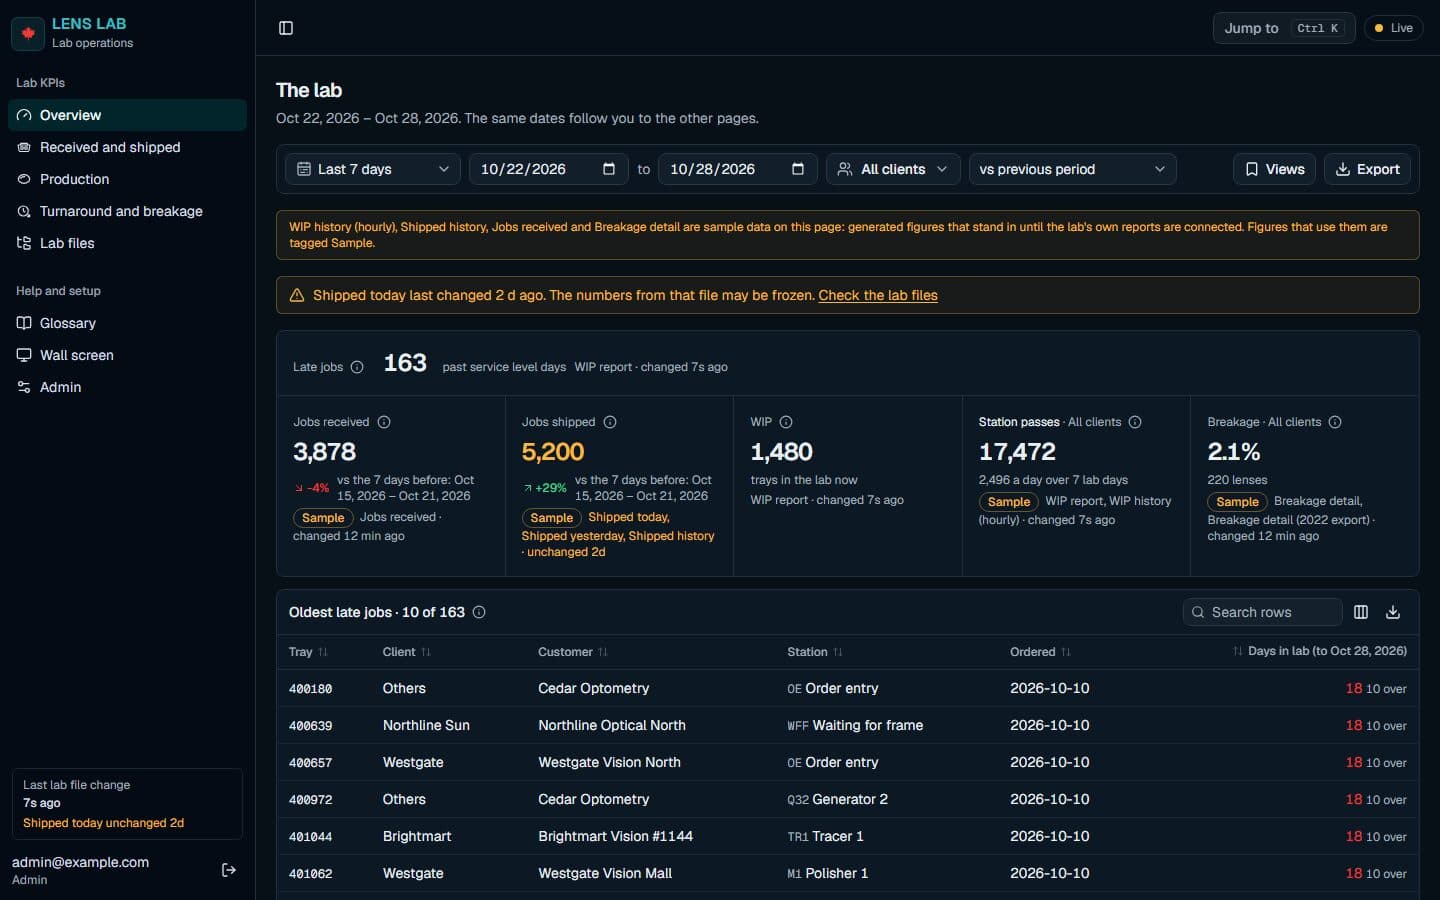
Every figure on the lab’s dashboard says how old it is.
An optical lab’s two production systems write their reports as CSV files to a shared folder. The dashboard reads those files, keeps their history, and shows work in progress, output by station and hour, turnaround and breakage.
- My part
- Design and build
- Built with
- React Router, SQLite, ECharts
- For
- Lab managers
The problem
what the lab worked from
The lab kept its targets, its turnaround columns and its output per hour in a spreadsheet. Its two production systems already write reports, but none of those reports gives output per hour.
Constraints
what it has to work within
It can only read. Its one way in is the CSV files the two systems leave in a shared folder, and it never writes back to either. The files can arrive half-copied, re-dated by a copy or in the wrong encoding, and some have no header row or no final line break.
What I built
the decisions, in order
A bad read changes nothing
Six checks run before a read counts. They catch a cut-off copy, a missing or doubled column, an empty file, more than half the rows unreadable, and a fall of more than a third. A read that fails one writes nothing, the figures keep the last good read, and the file’s status gives the reason.
See Plate II.
Hours from snapshots
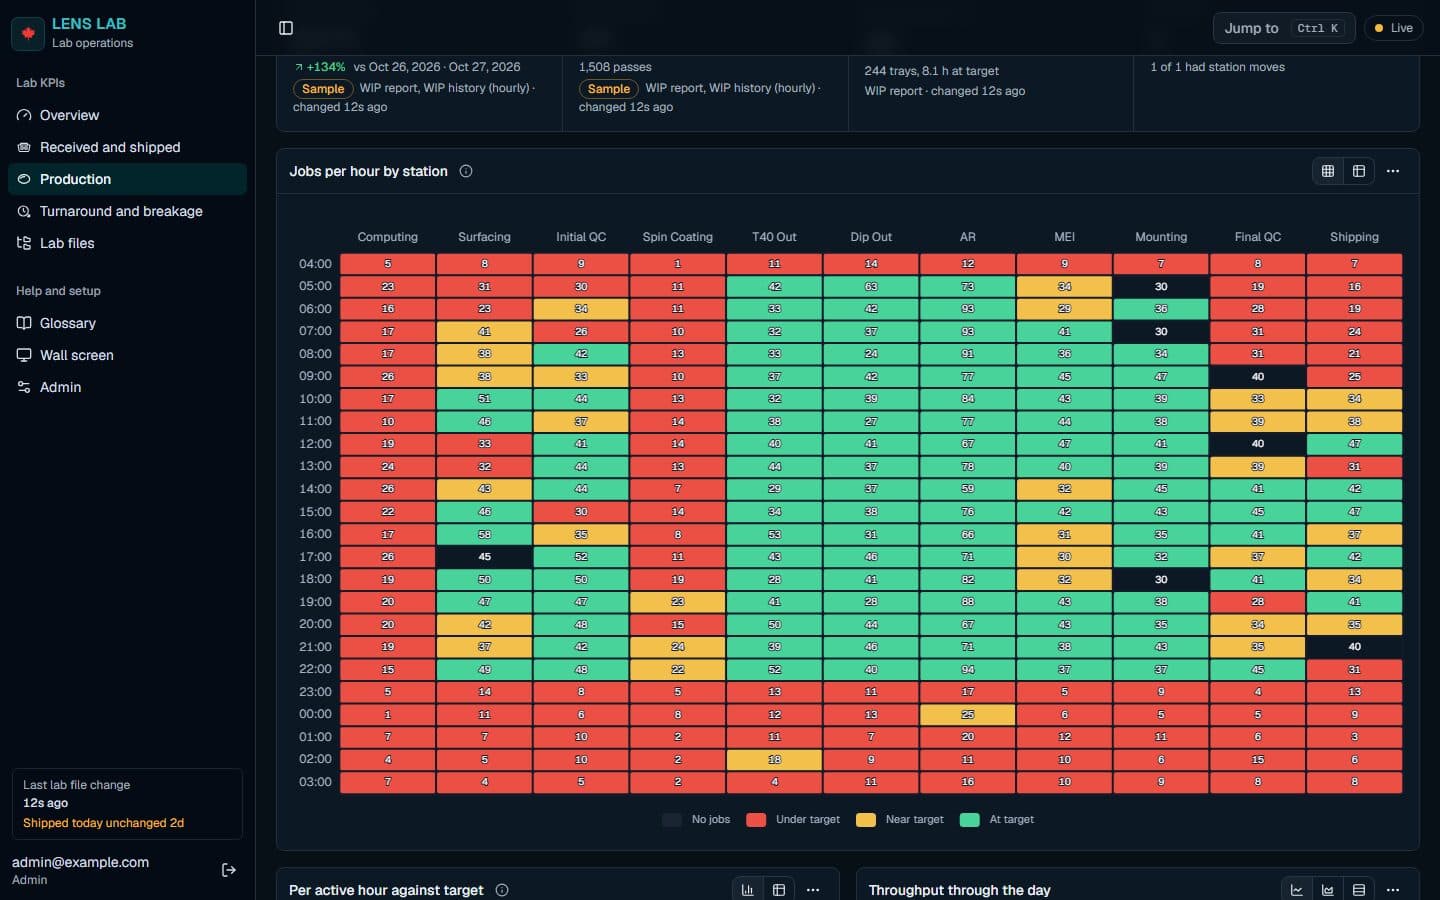
No report gives output per hour. The dashboard compares each copy of the work-in-progress file with the one before and counts every tray that changed station, which fills the grid of stations by hour.
See Plate III.
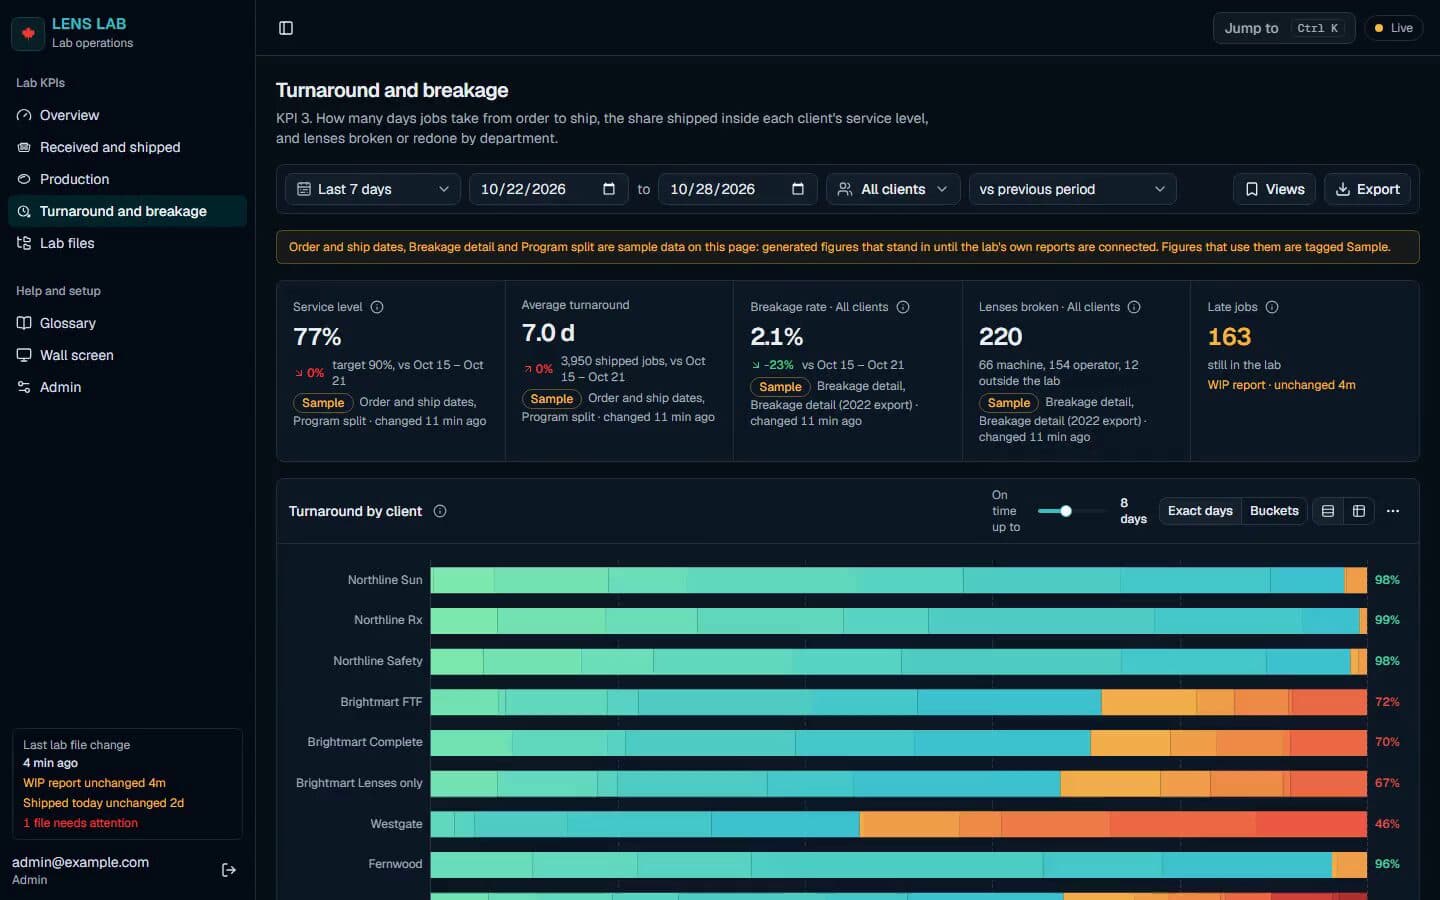
Turnaround by client
For each client, the share of jobs shipped on time for any limit from 1 to 20 days, or in the lab’s own buckets, beside service level against a 90% target.
See Plate IV.